Data Browser: Difference between revisions
Mmaciejewski (talk | contribs) Created page with "The NAN Data Browser is composed of four Dashboards. Datasets, Samples, Collections, and My Permissions. Users can navigate between them from the left-most high-level Navigation bar. Note that the bar is collapsible to gain additional screen real-estate and may need to be expanded if collapsed to select between the different options The Dataset browser allows users to view all datasets in which they have permission to view, including public and published datasets The..." |
Mmaciejewski (talk | contribs) No edit summary |
||
| (9 intermediate revisions by 2 users not shown) | |||
| Line 1: | Line 1: | ||
{{DataBrowser}} | |||
= NAN Data Browsers = | |||
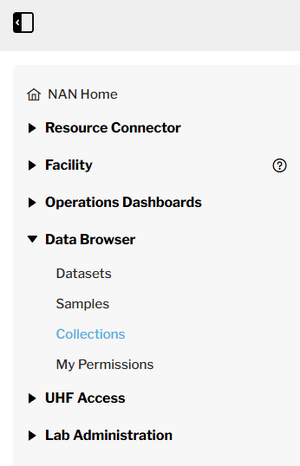
[[File:Data Browser Navigation Bar.png|thumb|'''Data Browser Navigation Bar''']] | |||
Initially NAN referred to the ''Data Browser'' as the tool to organize, search, and filter NMR datasets, but has evolved to include the ability do the same for ''Samples'', ''Collections'' (both dataset and sample), and a display for users to view their [[Lab Permissions|lab permissions]], ''My Permissions''. Thus, the ''Data Browser'', now refers to a series of dashboards: | |||
* '''[[Datasets]]''' | |||
* '''[[Samples]]''' | |||
* '''Collections''' | |||
* '''My Permissions''' | |||
== Accessing Dashboards == | |||
Users can switch between dashboards using the high-level navigation bar on the left side of the screen shown in the image on this page. | |||
The | * The navigation bar is collapsible to maximize screen space and can be collapsed / expanded by clicking the icon in the upper left hand corner | ||
The | == Dashboard Descriptions == | ||
Brief description of dashboards with more detailed information on their individual wiki pages | |||
=== [[Datasets]] === | |||
* Displays all datasets that the user has permission to view. | |||
* Includes public and published datasets, as well as any private datasets the user has access to. | |||
=== [[Samples]] === | |||
* Shows all samples for which the user has view permissions. | |||
=== Collections === | |||
* Displays both dataset and sample collections that the user is allowed to access. | |||
=== My Permissions === | |||
* Shows the lab groups and projects the user is affiliated with. | |||
* Lists the specific permissions the user has in each context. | |||
== Table Customization == | |||
The Datasets, Samples, and Collections dashboards all display data in tabular format. Each has one a column that is fixed as the first column, but users have the ability to customize the dashboards with the preferences saved in the NAN database allowing it to persist across sessions, browsers, and computers. | |||
* Users can customize: | |||
** Which columns are shown. | |||
** The order of columns. | |||
Latest revision as of 01:06, 16 June 2025
NAN Data Browsers

Initially NAN referred to the Data Browser as the tool to organize, search, and filter NMR datasets, but has evolved to include the ability do the same for Samples, Collections (both dataset and sample), and a display for users to view their lab permissions, My Permissions. Thus, the Data Browser, now refers to a series of dashboards:
Accessing Dashboards
Users can switch between dashboards using the high-level navigation bar on the left side of the screen shown in the image on this page.
- The navigation bar is collapsible to maximize screen space and can be collapsed / expanded by clicking the icon in the upper left hand corner
Dashboard Descriptions
Brief description of dashboards with more detailed information on their individual wiki pages
Datasets
- Displays all datasets that the user has permission to view.
- Includes public and published datasets, as well as any private datasets the user has access to.
Samples
- Shows all samples for which the user has view permissions.
Collections
- Displays both dataset and sample collections that the user is allowed to access.
My Permissions
- Shows the lab groups and projects the user is affiliated with.
- Lists the specific permissions the user has in each context.
Table Customization
The Datasets, Samples, and Collections dashboards all display data in tabular format. Each has one a column that is fixed as the first column, but users have the ability to customize the dashboards with the preferences saved in the NAN database allowing it to persist across sessions, browsers, and computers.
- Users can customize:
- Which columns are shown.
- The order of columns.